The Problem
Traffic data without weather context is half the story.
Existing traffic monitoring tools show you congestion — but not why it's happening. A jam factor of 8.5 means very different things on a sunny Tuesday versus during a nor'easter. This project fuses live traffic flow data from the HERE Traffic API with real-time weather conditions scraped from weather.com every 10 minutes, creating a unified dataset that reveals the relationship between weather and congestion across New York, Boston, and California.
Data Pipeline
From API call to dashboard in under 10 minutes.
Azure Functions (Timer Trigger)
Data collection — every 10 minutes
Azure Function fires on a cron schedule. Simultaneously calls the HERE Traffic Flow API v7 for speed, jam factor, and free-flow speed across each city's bounding box, and scrapes weather.com via BeautifulSoup for temperature, visibility, wind, humidity, and cloud status.
Azure Blob Storage
Persistent CSV storage
Each run downloads the existing CSV from Blob Storage, appends new rows, and re-uploads — a simple, cost-effective append pattern for moderate data volumes. All 15+ fields stored per street segment per city per run.
Azure Event Hub
Real-time streaming
Each batch of new data is simultaneously published to Azure Event Hub as a JSON payload, enabling downstream real-time processing via Fiber Event Stream and KQL Database for sub-second query performance.
Power BI
Interactive dashboard
Power BI dashboard with date and cloud status filters showing average current speed, jam factor, free-flow speed, city comparison bar charts, time-series congestion trends, and a map view of jam factor by street location.
Coverage
Three cities, continuous monitoring.
New York
Times Square / Midtown
Timezone: America/New_York
Highest average jam factor
Timezone: America/New_York
Highest average jam factor
Boston
Downtown / Fenway area
Timezone: America/New_York
Lowest average jam factor
Timezone: America/New_York
Lowest average jam factor
California
Los Angeles / Downtown
Timezone: America/Los_Angeles
Mid-range congestion
Timezone: America/Los_Angeles
Mid-range congestion
Variables Tracked
15+ fields per data point.
current_speed
free_flow_speed
jam_factor
confidence
traversability
segment_length
street_name
temperature
visibility
wind_speed
humidity
cloud_status
date
time
location
Tech Stack
Built on Azure.
Azure Functions
Timer trigger / compute
Azure Event Hub
Real-time streaming
Azure Blob Storage
CSV persistence
KQL (Kusto)
Query language
HERE Traffic API v7
Traffic flow data
BeautifulSoup
Weather scraping
Pandas
Data processing
Power BI
Visualization
Results
Fully automated, continuously running.
100%
reduction in manual data collection effort
1,440+
data points collected every single day automatically
6.67
avg current speed (kph) — New York worst performer
2.18
average jam factor across all three cities (0–10 scale)
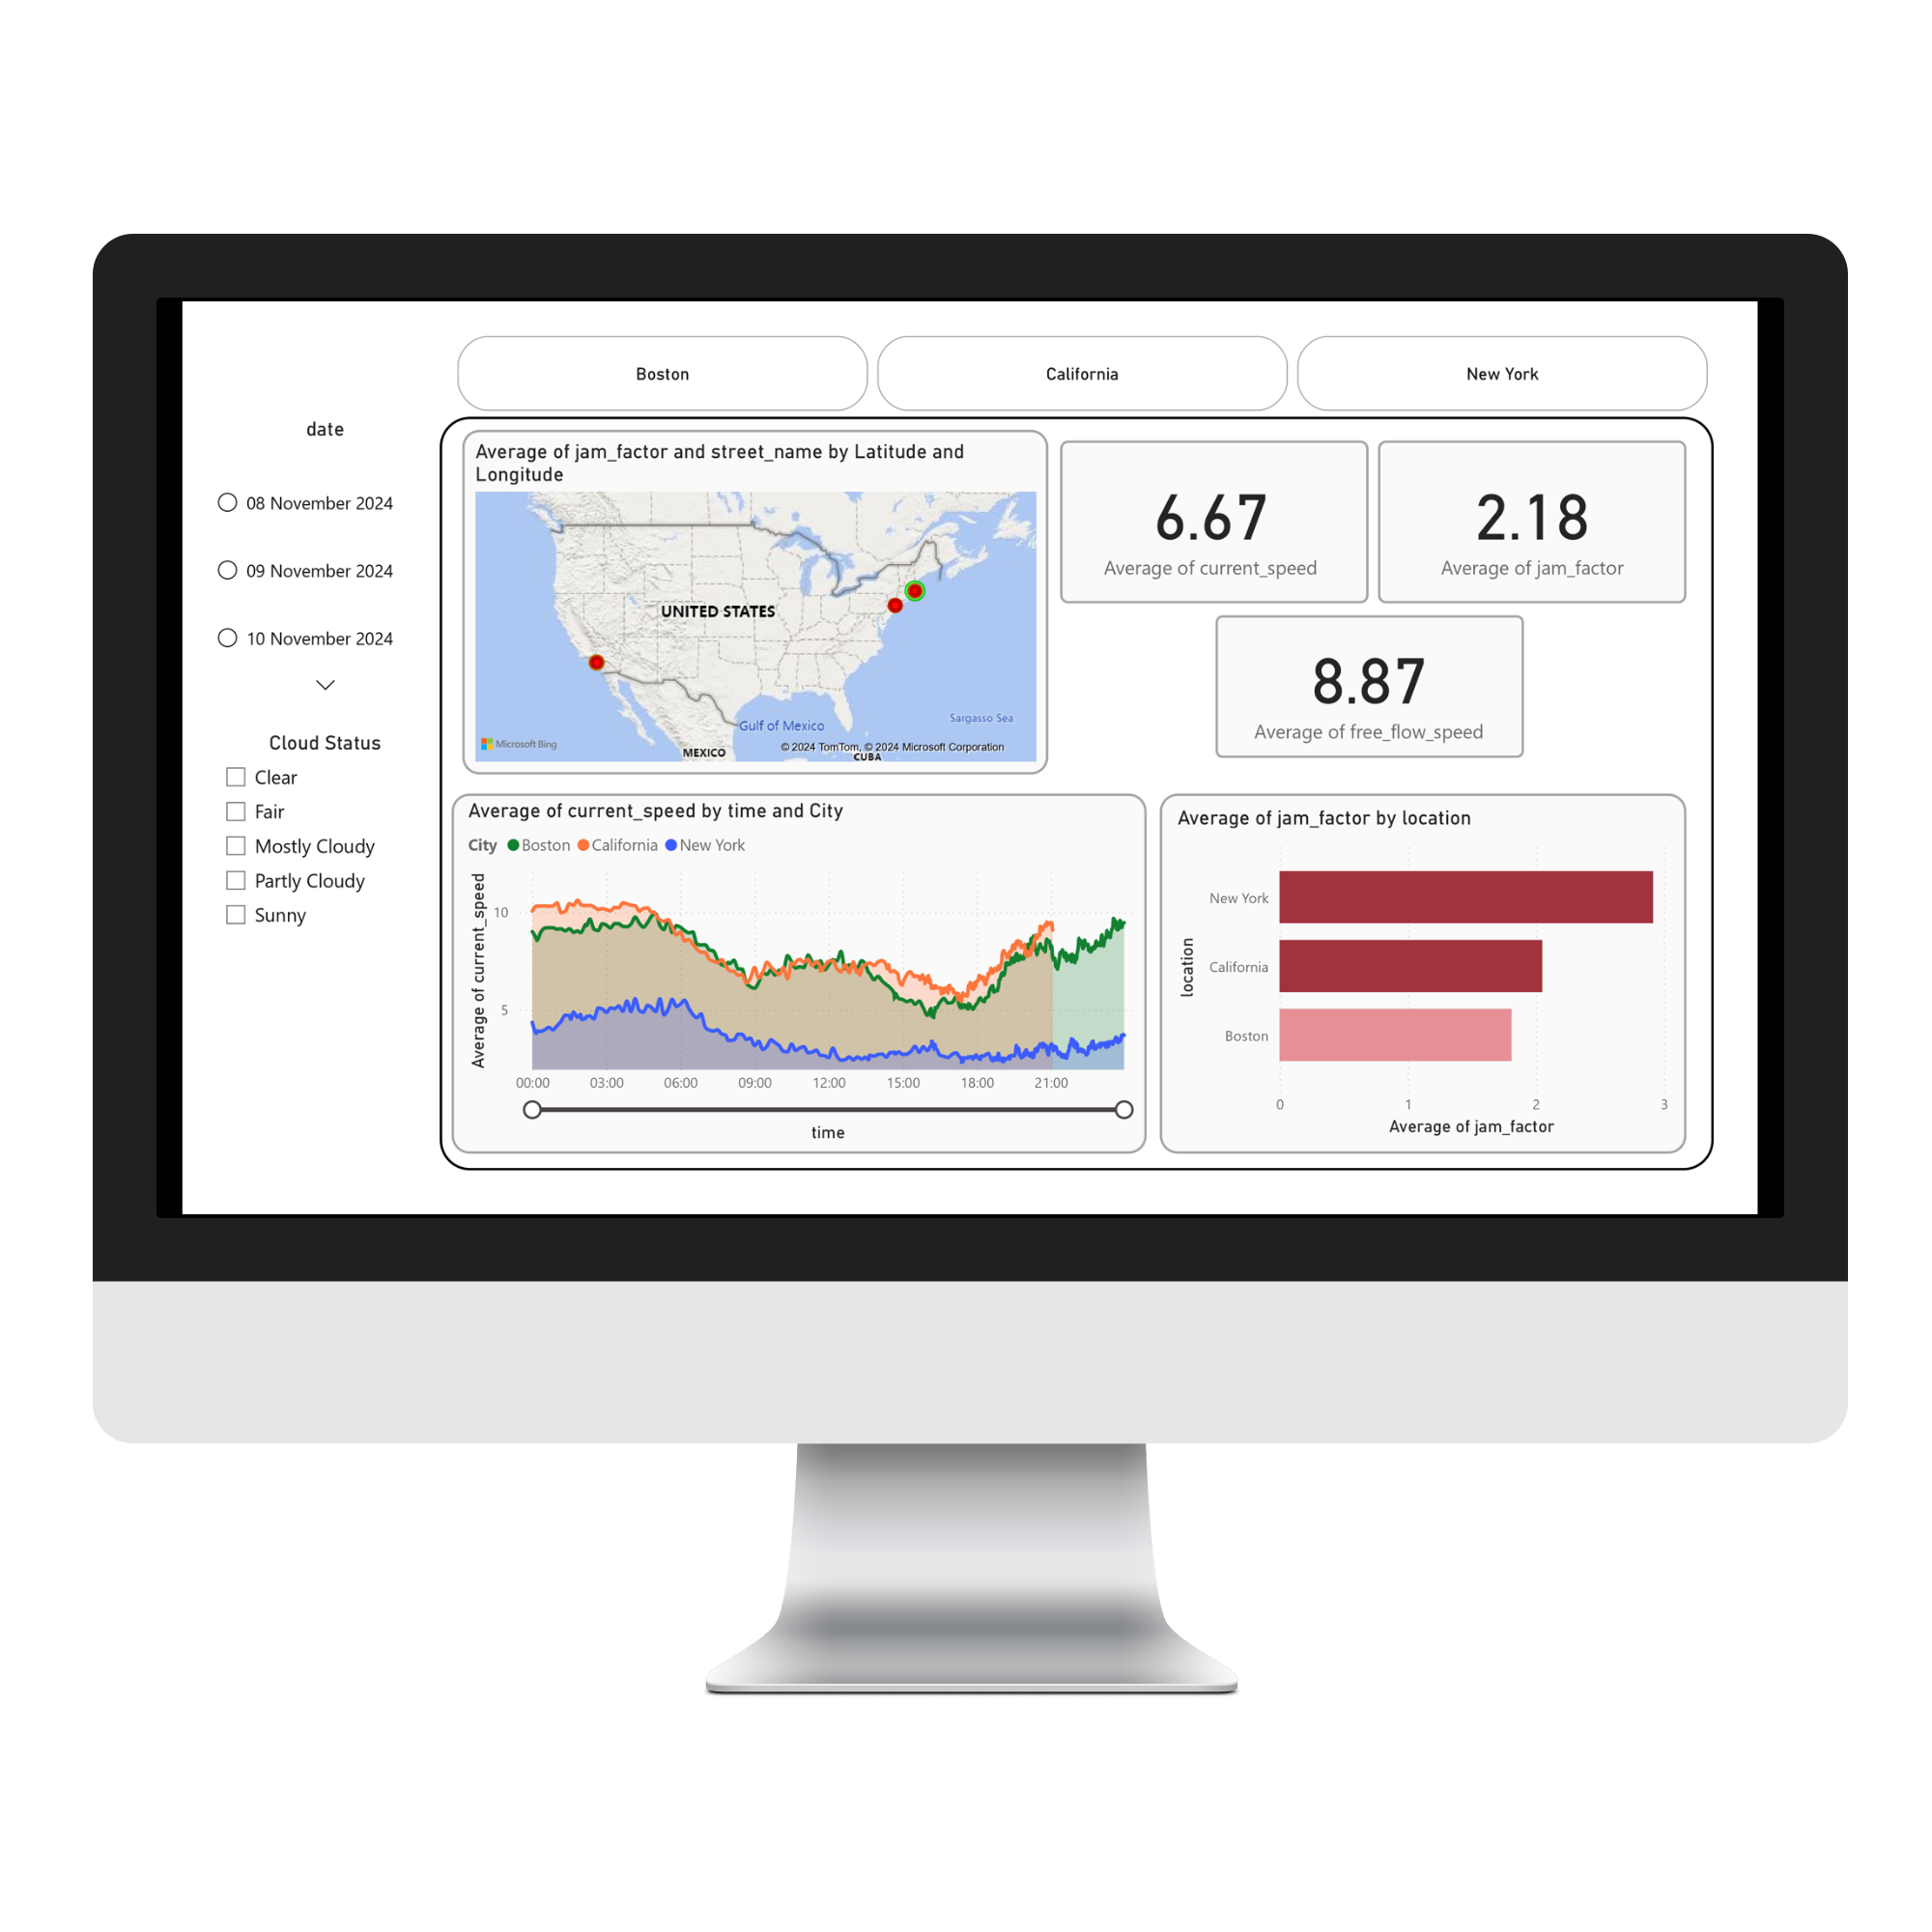
Power BI dashboard showing real-time jam factor by city, average current speed vs free-flow speed, time-series congestion trends, and date/weather filters — updated every 10 minutes via Azure Event Hub.